
Tribune co-written with Nicolas Chanut
“Knowledge is power”, the aphorism attributed to Francis Bacon, has never been more relevant than since the information and telecommunications revolution that started in the 1990s. In order to survive and to grow, businesses more than ever need to know what their customers want, to predict the time and place in the production chain where risk of failure is highest, or to anticipate demand in order to be able to respond to it, under penalty of losing markets to organizations that have better access to such information. The “information race” is so intense that the above quote might be modified to “better knowledge is higher market power.”
Today, most companies are aware of the importance of data, and of the information it conveys. However, all companies have not reached the same degree of mastery when it comes to appropriate data. Modern organizations, which we call Open Organizations, share five characteristics. Being data-driven is one of them.
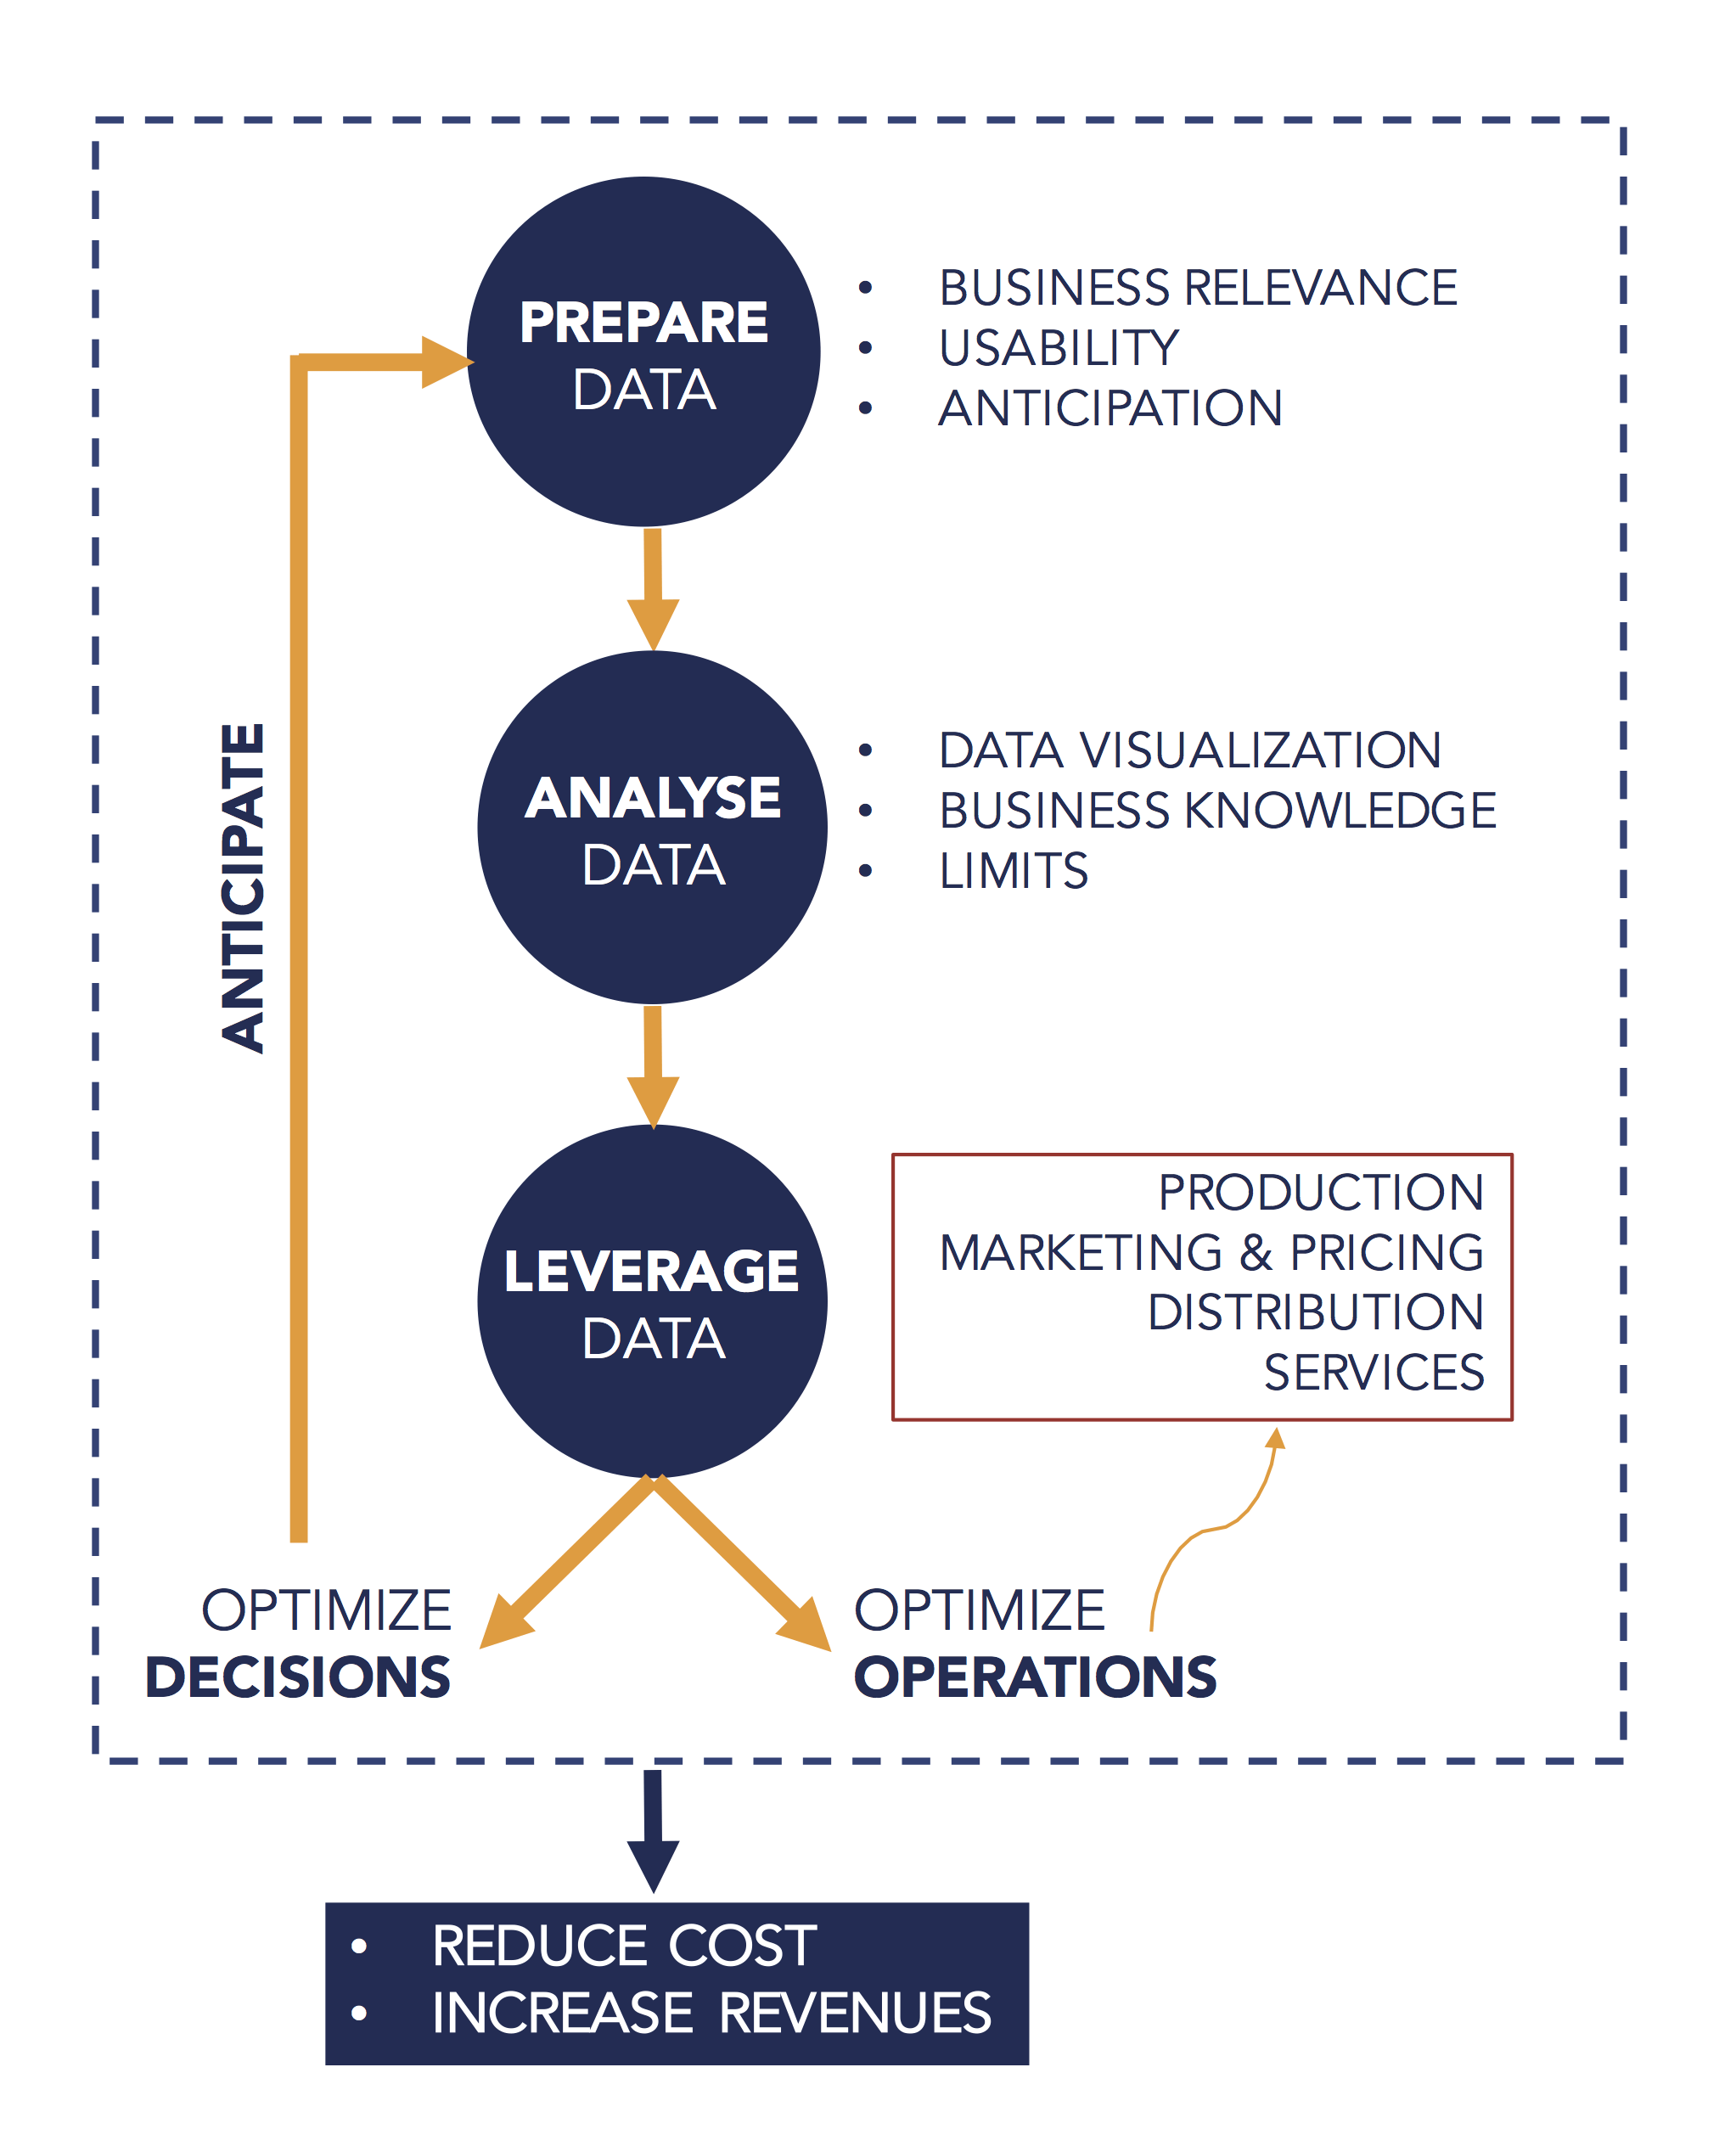 At Presans, we distinguish three steps in the process of becoming a data-driven company or organization. The first step consists in identifying, managing and organizing the data organizations require. Most companies have already thought this aspect out. The second step consists in building capacity for data analysis. This step is far more complex and often leads companies to hire consultants or to work with specialized startups. Success is based on optimizing the interaction between industry-knowledge and technical know-how in data analysis. The final step consists in using information extracted from the data to optimize processes and decision-making.
In the following, we will describe these three steps in greater detail.
Step #1 – PREPARE: identify, manage and organize the data
The first step to become data-driven is to identify, manage and organize the data that is essential to an organization. The key idea behind this step is to realize that, despite the increasing use of the term “big data”, what really counts isn’t the quantity, but the quality of the data. Data quality can be encapsulated in three principles:
Principle #1: business relevance of data
The data must give an answer to a concrete problem the enterprise faces. Often it is dangerous, and costly in terms of time and money, to collect a maximum of data without knowing how to use them afterwards. To the contrary, it is preferable to start with a business problem, and to provide high precision answers to the two following questions: “What are the major issues faced by my organization in the five coming years? What information do I need to respond adequately to these issues?” As an example, the oil transformation company Axens was aware that one of the big issues faced by its industry is cost reduction, in particular, failure rates. To achieve this, Axens quickly understood the need to create a very precise database of all occurrences of leaks, in order to enable predictive maintenance.
Principle #2: data usability
Once data is collected, the next essential step is to transform them into something exploitable. All data scientists agree to say 80% of their work consists of cleaning up data. There are several criteria that determine if a database is sufficiently clean and standardized. Here three that regularly show up and apply to a broad set of situations.
- The database is easy to update: this enables near real-time access to data;
- The database is easy to cross with other information;
- The database must be nimble: its architecture and its computing power must be adapted to exploitation in “real time.”
Principle #3: anticipation
Applying principles #1 and #2 as defined above requires a capacity for anticipation that most companies entering their digital transformation under-estimate. It is thus crucial to anticipate as much as possible the data needs (relevance) and their use (usability).
As an example, a major French government administration launched an internal innovation promotion program five years ago. However, the program managers did not consider during the design phase what metrics could be used to evaluate program performance. As a result, the data doesn’t exist and the impact of the program is hard to evaluate. A good way not to fall in this trap is to set up, over the course of a few weeks, a pilot program that will help to identify difficulties and the data needed to overcome them.
Step #2 – ANALYSIS: building the capacity to analyze data
It is much harder to build an excellent capacity to analyze those data. This stems from the fact that high performing analytics require excellent interactions between the technical know-how involved in data analysis and knowledge of a particular industry. We underscore three fundamental aspects that serve as quality markers for analysis.
Aspect #1: DATA VISUALIZATION: if you understand it, you can visualize it with clarity
Condensing the information contained in millions of data points into an easy to understand the message is a real skill that can make a big difference within an organization. In particular, since the emergence of big data, most learning specialists agree to say that nothing performs as well as a graph or an interesting image when it comes to identifying and quickly communicating important issues. This is so much the case that Boileau’s famous sentence should be reformulated: “If you understand it, you can visualize it with clarity.” Thus a data-driven organization should have internal capacities not only to collect the data it needs but also to visualize them. For example, David McCandless’ TED Talk shows how a simple data visualization makes it possible to identify patterns in a set of data.
Aspect #2: Business knowledge: knowing which questions aren’t answered by data analytics
Condensing so much information into a single graph requires the analyst to make choices: do I prefer to show the evolution of defective units produced by a machine as an absolute value, or rather in relation with the total number of units produced? This choice depends on the question that needs to be answered. If I am contractually engaged to compensate for each defective unit, I will use the absolute value. If I want to measure the performance of a given machine, I will use the relative quantity. This example shows two things. First, it shows the power and the responsibility of those who handle data, because their choices aren’t neural. Next, it shows that technical analytical know-how (data visualization, machine learning, etc.) must go hand in hand with the strategic understanding of an industry. Thus, when we examine a graph, it is imperative to also ask ourselves what questions aren’t answered by it.
Aspect #3: LIMITS: awareness of tool limitations
Finally, a data-driven organization is aware of the limitations of artificial intelligence, despite its importance and trendiness. To understand those limits, one must understand how the machine learning algorithms function, that is used for instance for predictive maintenance. All function on the same principle: the algorithm is trained to spot constants and recurring patterns within a set of data (for example, between X and Y), so as to be able to effectively predict the value of Y if we can observe the value of X. What too few remember to add to this is that such algorithms provide good predictions in a constant environment. It is thus important to realize that if the environment suddenly changes (weather catastrophe preventing satellite communication, the industry entered by game-changing digital barbarian, etc.), then the quality of data predictions will be diminished.
Step #3 – LEVERAGE: using data to optimize operations and decision-making
An Open Organization applies the data it has collected and analyzed in two fundamental directions: Firstly, in order to optimize operations, secondly in order to optimize (strategic) decision-making.
Direction #1: Optimizing operations to reduce cost and increase income
Data-driven organizations use data to optimize all levels of their operations, both for cost reduction and revenue generation.
- Production: companies such as Airbus and Renault use data across their entire production cycle, for instance in order to follow the evolution of their units on assembly lines, or to reduce energy consumption.
- Marketing and pricing: according to McKinsey consultants, it’s in sales and marketing that artificial intelligence can deliver the most value in the coming 20 years, particularly when it comes to predicting with unequaled precision demand for certain products. As an example, Amazon can predict demand for millions of products up to 18 months ahead. Other algorithms make it possible to optimize prices to bring them closest to the maximum customers are willing to pay on average, depending on their characteristics. This is already standard practice at airline companies, but will certainly be generalized to other industries with the development of large databases.
- Distribution: artificial intelligence plays an essential role in the optimization of distribution. As an example, Ocado, a British e-commerce company, uses technologies that come from air traffic control to optimize the preparation and delivery of orders.
- Customer service: finally, data and artificial intelligence enable higher quality customer service. Car manufacturers now offer predictive maintenance services to predict when and how cars need to be overhauled. Predictive maintenance is also of great importance in the oil and gas industry because those companies need to manage huge infrastructures.
Direction #2: Optimizing (strategic) decision-making by reducing cognitive biases
The second direction in which to apply data and data analytics is the optimization of decision-making. Making a (strategic) decision without quantitative justification is unacceptable today. Data analytics thus becomes a necessary tool (although not a sufficient one, as shown above) for decision-making, et especially to convince others regarding the soundness of the decision. In particular, one relevant way to use available data is as an argument to limit certain cognitive biases[1] such as excessive confidence or anchoring.
Overconfidence is the bias of “believing in one’s lucky star”, believing that our personal experiences aren’t subject to the same hazards as those of others. For example, individuals overestimate their chances of finding work when they are unemployed, compared to the average duration for people with similar characteristics; managers tend to overestimate their project’s chances of success in comparison to projects with similar characteristics that they aren’t in charge of. In these cases, using predictive models can shed a more objective light on a situation by pointing out who are the individuals or projects “with similar characteristics” and what can be learned from them.
In the same way, we all suffer from “anchoring” in our decision-making, which simply means that it is difficult to override first impressions. If I have already been unemployed for six months and I am unemployed again today, I will tend to anticipate an unemployment duration of about six months, even if conditions have changed dramatically. In a similar way, if 6 of my 10 projects were successful last year, I will tend to anticipate a coming success rate of about 60%, say 70% if I am ambitious. A more precise analysis of the data could, on the contrary, inform me that I am entitled to expect a success rate of 90% in view of the current environment, and could lead me to make an informed decision more objectively.
In a nutshell, a data-driven organization is an organization that uses data in all aspects of its business, while understanding its limitations.
[1] Je sais ce que vous pensez !, Rémi Larrousse (2018)